
Code-Document Analysis: Relative Frequencies
Relative frequencies are useful for comparing code distributions across or within documents or document groups, as percentages are easier to comprehend.
If documents are of unequal length, or if document groups have an unequal number of members, it is recommended to normalize the counts as absolute counts may distort the results. See Data Normalization.
Across Group Comparison: Row Relative Frequencies
The table shows data from interviews about suitability. You can download the project here.
You must read this table from left to right along the rows. It shows the distribution of the selected codes across the following two document groups:
Interview with experts and interview with Layperson A quick glance at the heat map suggests that experts talked more about public transportation as a sustainable transport option, while laypersons talked more about active transportation such as walking or cycling.
Whether you need to select row or column relative frequencies depends on which way around the table is displayed. If documents/document groups are listed as rows and the codes as columns, you use row relative frequencies for a within group comparison.
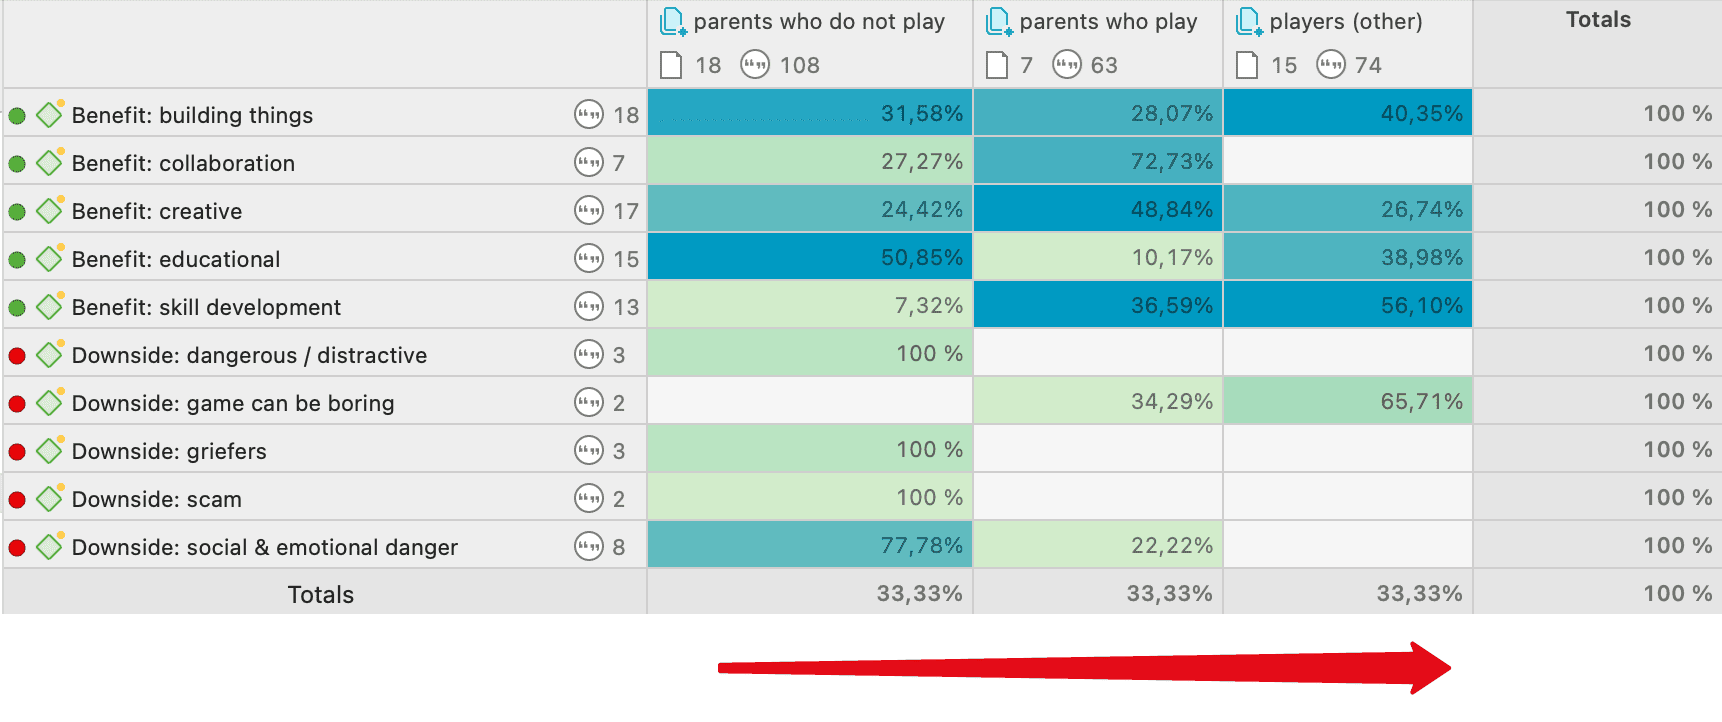
Within Group Comparisons: Column Relative Frequencies
The following example is from the sample project: Children & Happiness. Compared are in what kind of relations the readers wrote about positive and negative experience of parenthood.
This table from the Sustainability sample project compares how experts and laypersons discussed barriers (challenges to adopting sustainable behaviors) and facilitators (factors that make sustainable living easier) in everyday life.
As can be seen from the table, the interviews with expert mention about factors that make sustainable living easier in everyday life slightly more often than those with layperson.
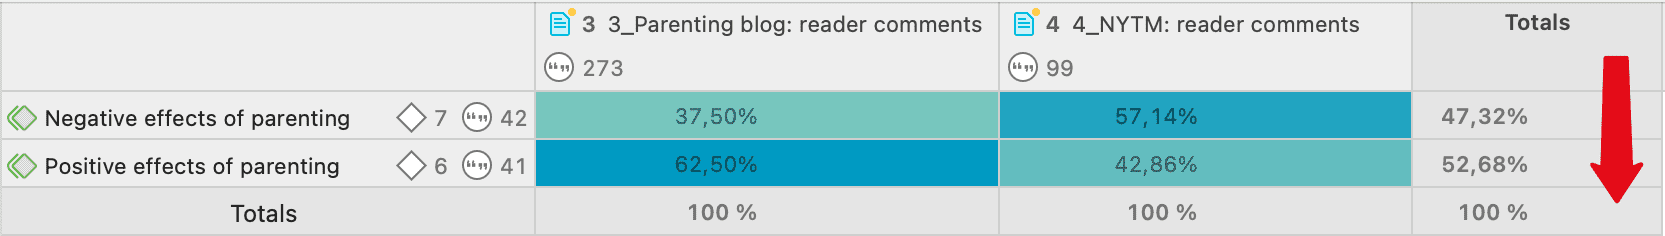
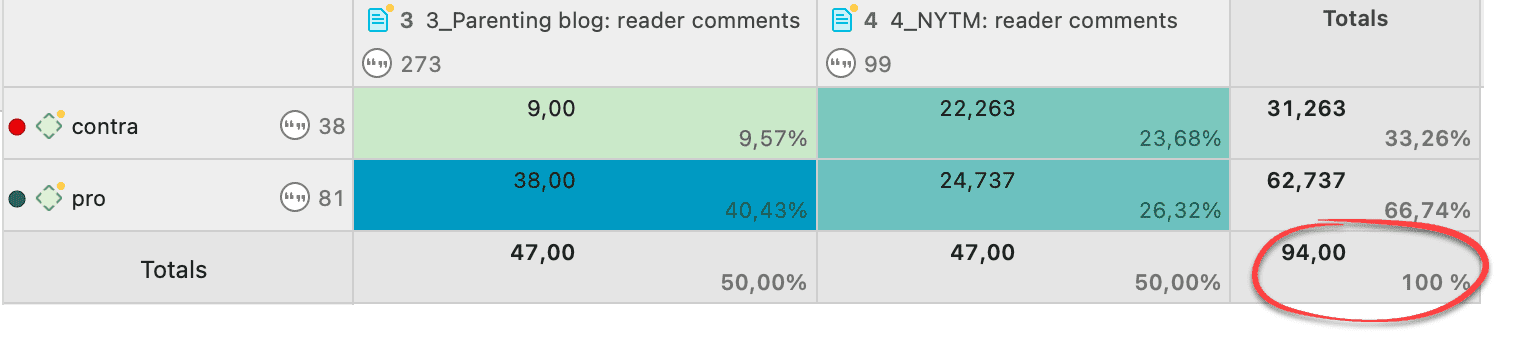
Total Relative Frequencies
If you select total relative frequencies, the calculation is based on the total number of codings of all selected codes in the table. Below it is compared who has provided more or fewer reasons for having or not having children:
Both groups of participants spoke extensively about financial costs and rewards related to sustainable living. Experts contributed 30.33 out of 168 in total (18.06%), while laypeople contributed 24 out of 168 (14.29%), indicating that experts spoke more about how financial costs and rewards can influence people's attitudes toward sustainability.
You can display all values: absolute frequencies and all relative frequencies in one table by selecting all options. It depends on the purpose for which you want to use the table. For interpreting the data, it is probably easier if you look at each of the relative frequency counts separately. For a comprehensive report for an appendix, you may want to export the table with all options included.