
Code Manager
The Code Manager is frequently used to:
- create and modify codes
- code data segments via drag & drop
- set code colors
- retrieve coded data segments
- organize them in code groups
- merge and to split codes
- filter them
- review them in networks
- review its content using word clouds, word lists and treemaps
- create reports.

In the bottom pane below the code list, you can either see a quotation preview for a selected code, or a chart. For more information about the chart, see Code Distribution Over Documents.
To change between quotation preview and chart view, select either Preview or Charts in the segmented control at the top-right corner of the bottom pane.
Good to know
Groundedness: Code frequency or groundedness. It shows how many quotations are linked to a code.
Density: Number of linkages to other codes. See Linking Nodes.
Colors: If you add code colors, a colored circle is displayed in front of the code icon and name. Code colors also have an effect on the display of code nodes in networks. See Working with Networks.
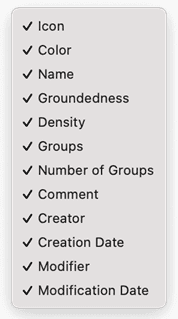
If you do not want to see all columns, right-click on a column header and deselect, what you do not want to see.
Selection behaviour
A double click on a code opens the list of linked quotations in the Quotation Reader You can browse through the list of quotations and view them highlighted in the context of its document. If there is only one quotation linked to a code, it will immediately be highlighted in the context of its document.
Single-click: Selects a code. If you have written a definition for the selected code, it is displayed in the comment pane in the inspector on the right. Once selected, the code can be used for drag & drop coding, or you can add it to a code group via drag & drop.
Multiple Selection: You can select more than one code at a time by holding down the Ctrl or Shift key. This is useful to:
- delete multiple codes
- code a data segment with multiple codes
- open a network that includes all selected codes
- create reports based on the selected codes
- assign multiple codes to a code group or to remove them from a group
- create a new code group based on the selected codes
Drag & Drop
You can use the Code Manager as a convenient tool for coding by dragging codes onto a highlighted piece of data. If you drag codes onto another code within the same list pane, code-links will be created. If you drag a code on top of another code in the margin area, it will be replaced.
Filter
Click on one or more code groups in the filter area on the left to set a local filter. This means only the items in the manager are filtered. If you want to filter your entire project, then you need to set a global filter. See Applying Global Filters for Data Analysis.
Code Manager Toolbar

From left to right:
New: Add a new code, smart code, code folder, code group or smart code group to your project.
Delete removes the selected code(s) from a project. This is a permanent deletion. You can revert the action using Undo, but only within the currently active session.
Grouping: You can view the list of codes in different ways. You can group them by code groups, smart codes, documents, document groups, or creating / modifying user.
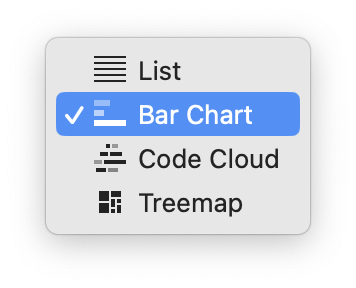
View Mode: You can view codes as a list (default), a bar chart, a code cloud or a treemap:
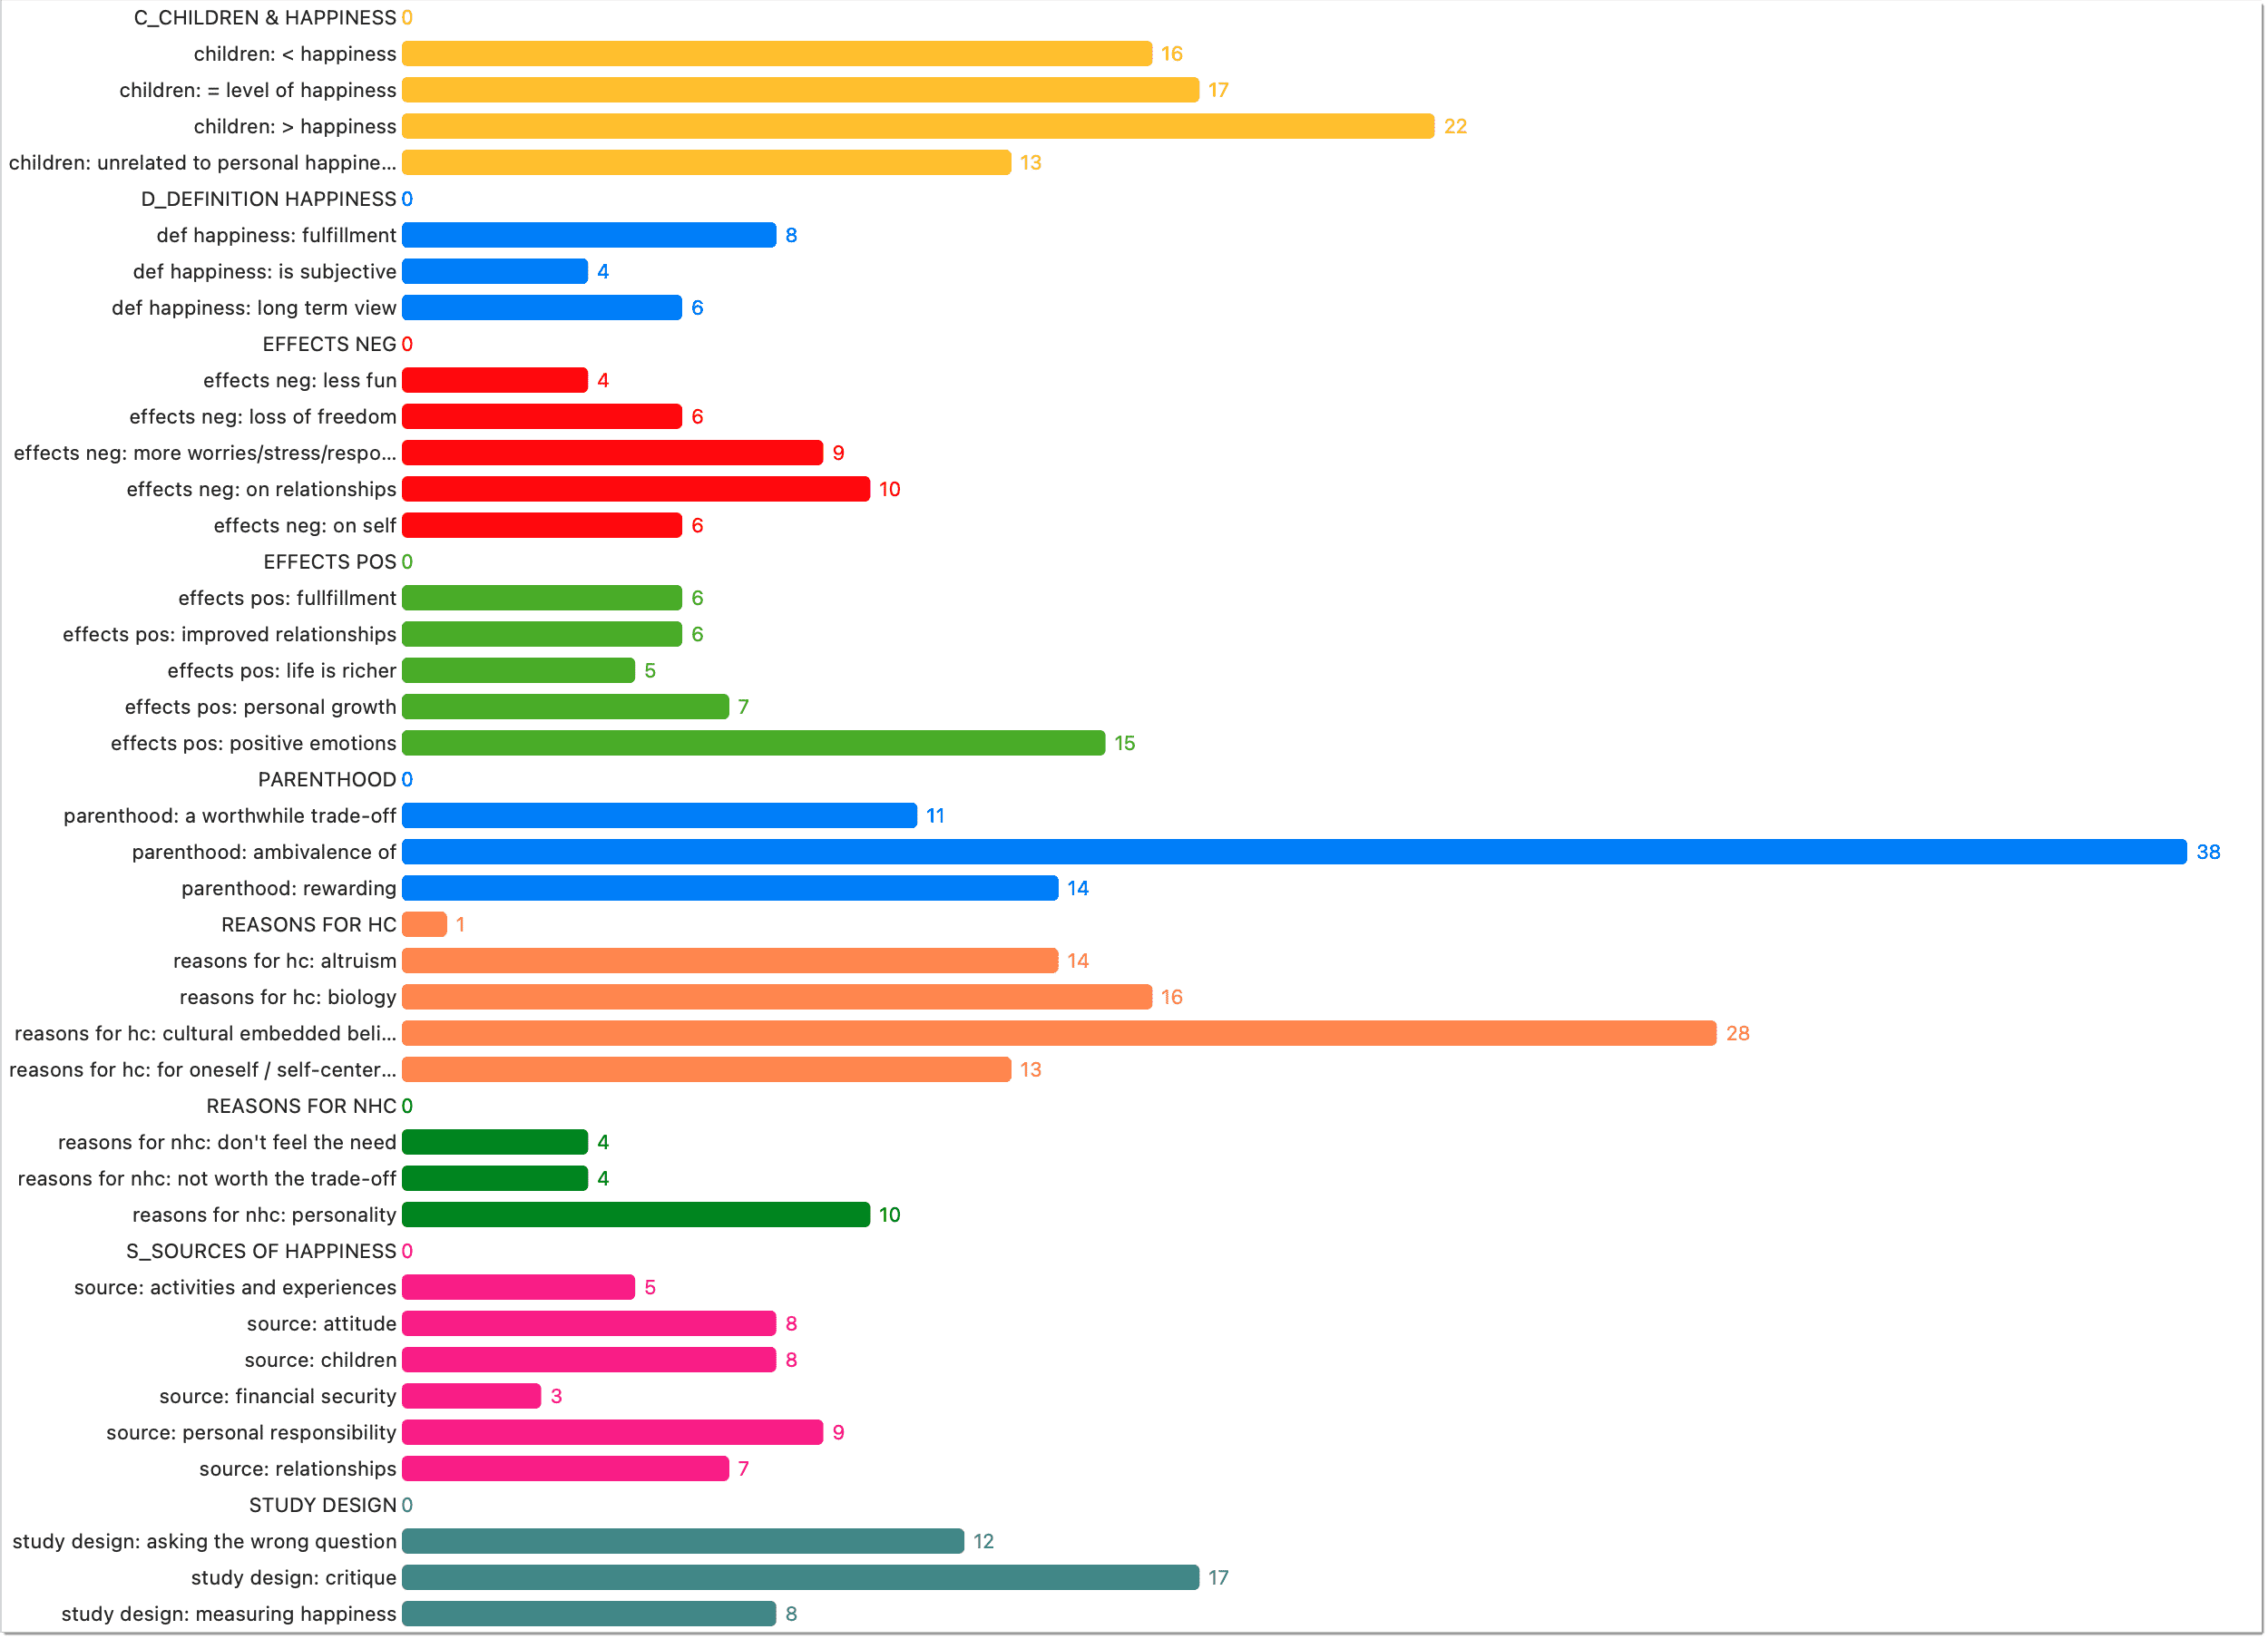
Code List as Bar Chart
Select the Bar Chart menu item to visualize your code list as a bar chart:
Code List as Cloud
Select the Cloud menu item to visualize your code list as a word cloud:

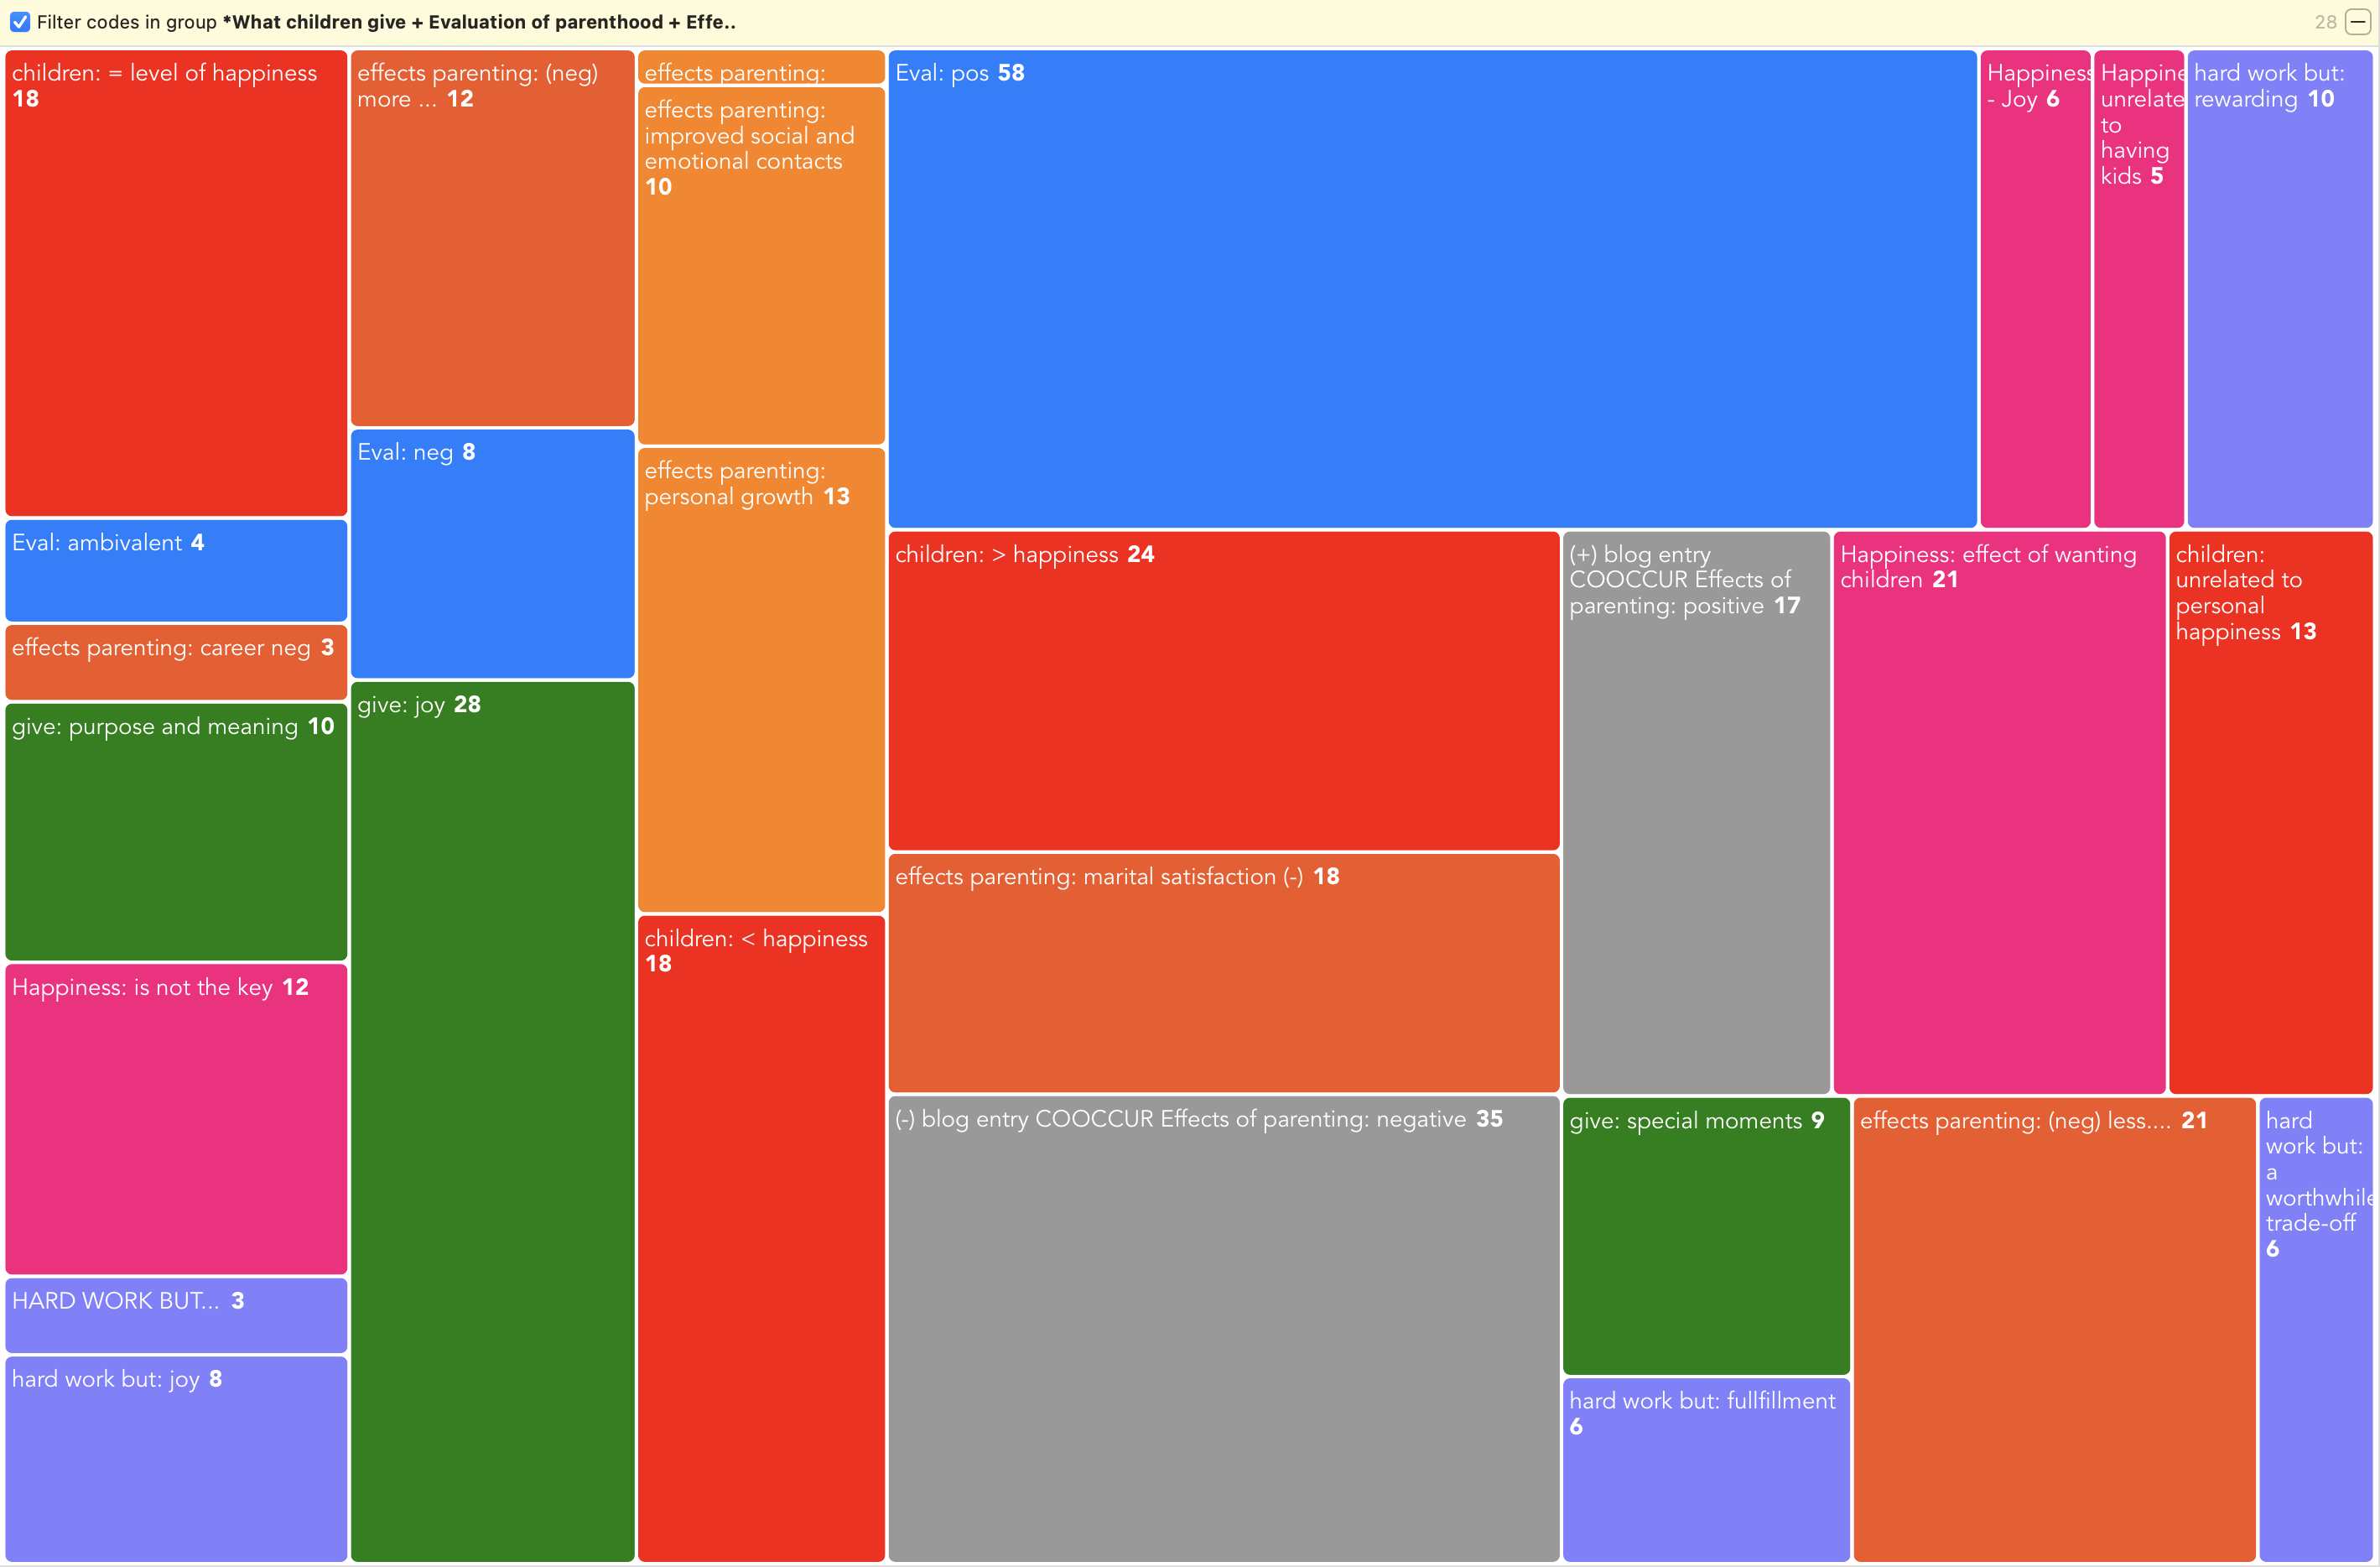
Code List as Treemap
Select the Treemap menu item to visualize your code list as a treemap:
Right-clicking on a code in the bar chart, cloud or treemap views opens the same context menu as in the list view. This enables you to work with the same actions, e. g. renaming codes, setting a color, splitting codes, or opening a network with one or multiple codes.
Export
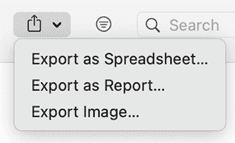
-
You can export the code list as spreadsheet for Numbers or Excel. When exporting a spreadsheet, you get a WYSIWYG report of the manager. You can exclude columns, by clicking on any of the column headers and select what should be included in the report.
-
Another option is to create a customizable report as text file (see Creating Reports).
-
The cloud and bar chart view can be exported as image in png format.
-
You can also export a codebook in XLSX or QDC format.
Filter
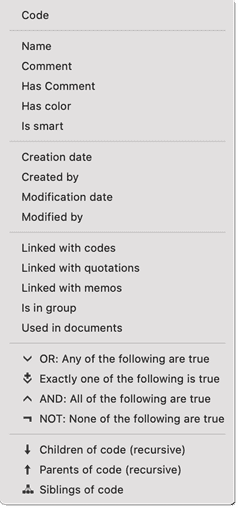
Via the filter, you can query your codes. For instance, you can search for codes created by a particular user, you can search for comments with comments or for codes that are linked with other codes. For further detail on how to build a query, see Querying Data in the Quotation Manager.
Search
Enter a few letters into the search field and ATLAS.ti will search for all codes with this letter sequence.
Layout
Under layout, you have options to activate or deactivate codes, preview and inspector. If you click on the pin ( Always on Top), then the windows stays on top.